
Introducing Sidewinder Flow Studio
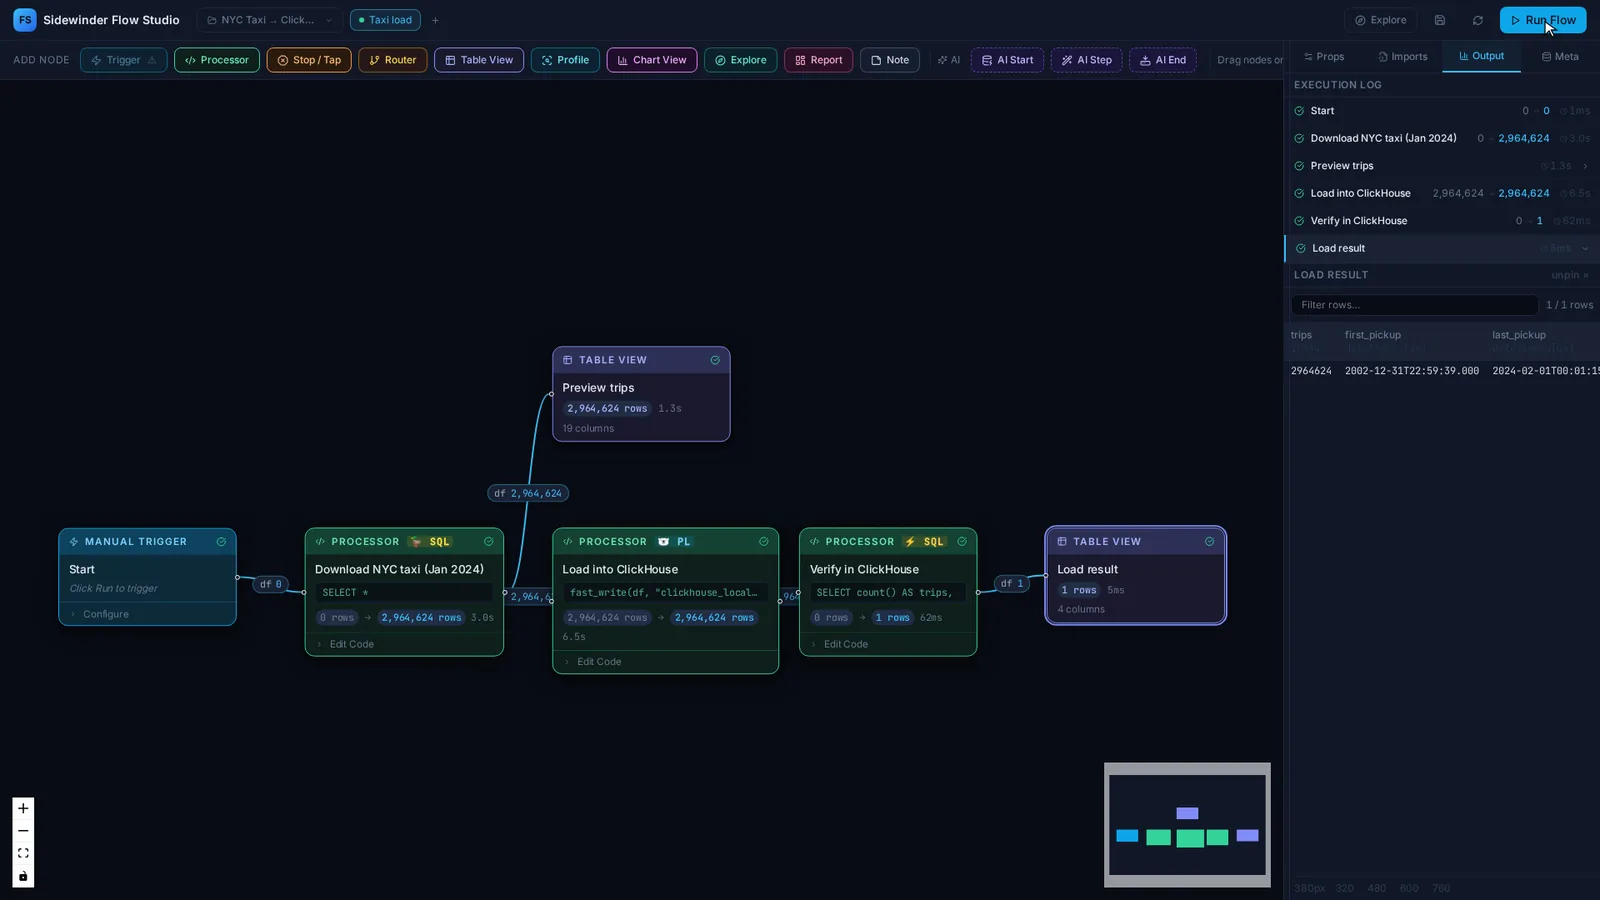
Most visual data tools hide the work inside configuration boxes. Most code-first tools hide the data: you write a script, run it, and hope the intermediate steps did what you meant.
Flow Studio takes a different line. The canvas is the map of your pipeline, and every node on it is a short piece of Python or SQL you can read. Between nodes, data is cached as Apache Arrow, so any step can be opened and inspected. When a result looks wrong, you click the node where it went wrong, instead of adding print statements and running everything again.
Because the cache is Arrow, nodes don’t have to agree on a library. A pandas step can feed a DuckDB query, which can feed a Polars transformation, with almost no conversion cost. And when data already sits in a warehouse, a node can run its SQL there and bring back only the result.
The latest release adds Explore: drag-and-drop charts over any node’s output or a live database. Charts compile to SQL and run where the data lives, so a 30-million-row table answers in under a second.
Flow Studio is open source under AGPL-3.0 and runs on your own infrastructure. It’s built by one person and released every few weeks. If you try it, issues and ideas are genuinely welcome.